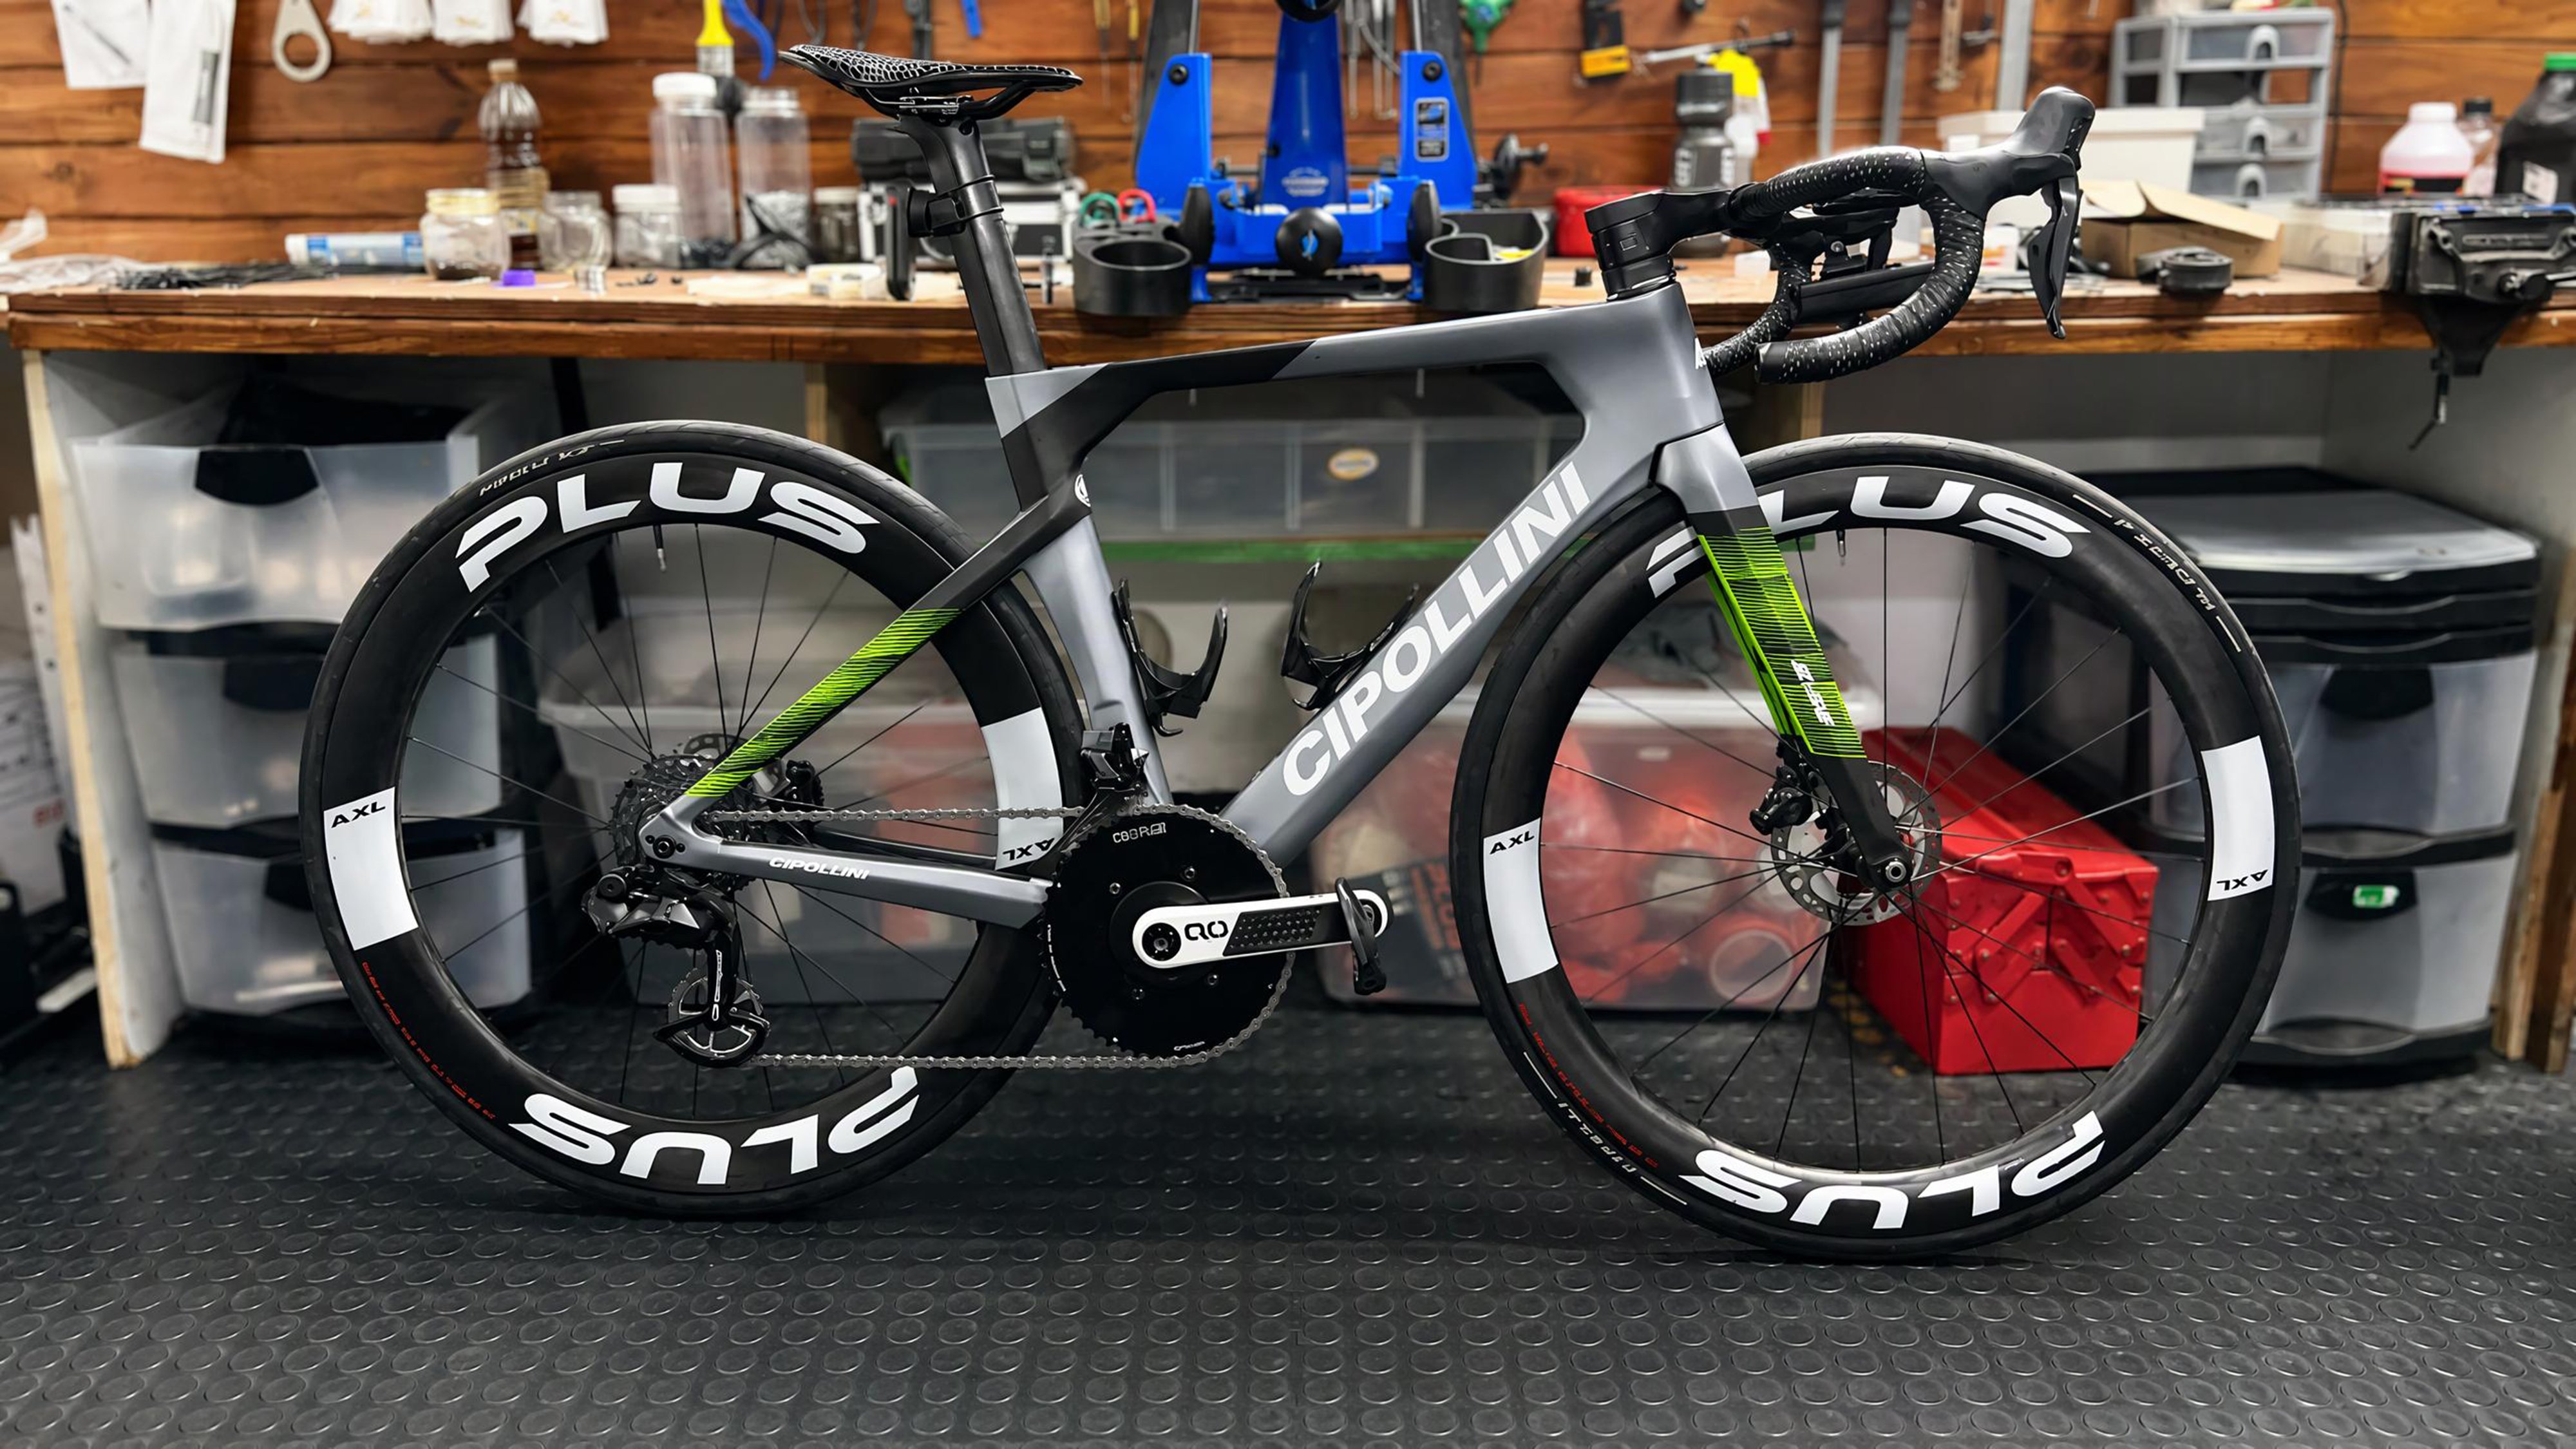
Aero Wheels: Rim Design, Tyre Setup and Real-World Speed

A wheel and tyre form an aerodynamic system. Rim depth, profile, inflated tyre shape, riding speed, and wind direction all affect the result. Choosing by depth or the size printed on a tyre leaves important variables unaccounted for.
This guide examines how wheel design and tyre setup affect aerodynamic drag, crosswind forces, and on-road performance. It draws on peer-reviewed wind-tunnel research, labels each study's method and limitations, and flags where the answer is genuinely uncertain. The aim: informed equipment choices through verified engineering, not unsupported speed claims.
If you ride road or gravel where aerodynamics compete with rolling resistance, comfort, and grip, the detail here applies directly. PLUS Aero builds aero wheels across a range of depths and internal widths for road and gravel, so the engineering rationale behind each trade-off laid out here informs real decisions across that lineup.
Key Takeaways: Aero Wheels, Rim Design and Tyre Setup
- Rim depth alone does not determine aerodynamic drag; profile shape, tyre-to-rim width ratio, and yaw angle all contribute independently.
- The front wheel operates in cleaner airflow than the rear, but both wheels affect handling and overall drag.
- Measured inflated tyre width often differs from the nominal size printed on the sidewall, and this gap changes with rim internal width.
- Watt-savings figures depend on assumed speed, air density, CdA delta, and test method, so always check the stated conditions.
- PLUS Aero offers road wheelsets with different rim depths, giving you options to evaluate against your conditions.
Why Rim Depth Alone Does Not Determine Aerodynamic Drag
A deeper rim has a longer chord, which can sustain attached airflow over a wider range of yaw angles under certain conditions. That is the theoretical basis for deep-section aero wheels. The engineering principle is real. The conclusion that deeper automatically means lower drag is not supported without considering other variables.
Profile shape matters independently of depth. The transition from tyre to rim is a critical aerodynamic boundary. If the tyre and rim widths are mismatched for the profile, the airflow behaviour changes regardless of how deep the rim is.
What Did the Wheel–Tyre Wind-Tunnel Study Measure?
Crane and Morton (2018) tested six wheels with five tyres in a wind tunnel. Tyre widths ranged from 21.40 mm to 26.15 mm, rim depths from 55 mm to 90 mm, rim widths from 19.28 mm to 25.75 mm, across yaw angles of 0° to 12.6°.
Their results showed that the tyre-to-rim width ratio correlated with wind-averaged drag. Side force was mainly related to rim depth. That finding identifies a measurable relationship within the tested combinations; it does not establish the performance of an untested modern wide-rim setup.
You cannot evaluate a wheel on rim depth alone. You need to know the rim profile, the outer width, and how the intended tyre interacts with that profile at the yaw angles you actually encounter.
How Rim Profile and Tyre Interface Affect Airflow
When wind meets a wheel at an angle, the rim acts as a short-chord body in crossflow. A rim profile that maintains attached airflow across a range of yaw angles will produce different drag and side-force characteristics than one where flow separates early. The specific profile geometry drives this behaviour.
Around the rotating wheel, airflow encounters both tyre-to-rim and rim-to-tyre transitions. Tyre protrusion, casing curvature, and tread texture change that combined shape. A profile label such as U-shaped, V-shaped, or toroidal does not describe all the geometry needed to predict performance.
What the Tyre-to-Rim Width Ratio Means for Drag
Crane and Morton's 2018 wind-tunnel data showed that the ratio of tyre width to rim width correlated with wind-averaged aerodynamic drag across their test matrix. Wheels where the outer rim width was wider relative to the tyre tended to produce lower drag in that dataset.
SILCA’s 105% explanation describes a rule of thumb developed from earlier wind-tunnel work: outer rim width should be at least 1.05 times measured tyre width. This is practitioner guidance, not a universal compatibility standard or proof of an optimal modern setup.
Keep the ratio direction clear: a hypothetical 30 mm measured tyre would require 31.5 mm outer rim width to meet that heuristic. Meeting it does not guarantee low drag. Missing it does not establish incompatibility. Neither conclusion replaces testing or the manufacturers’ fit requirements.
Front and Rear Tyre Choices: Aerodynamics, Rolling Resistance, and Grip
The front wheel operates in relatively cleaner airflow than the rear. The rear wheel sits behind the frame, bottom bracket, and the rider's legs, encountering more turbulent, disturbed air. This difference in flow environment means the two wheels have different aerodynamic sensitivities.
This does not mean the rear wheel's aerodynamics are irrelevant. Both wheels contribute to total system drag. Both wheels also affect handling. Choosing different front and rear tyre widths is a legitimate approach, but the whole system should be considered and ideally tested together, because changes to one wheel affect the airflow reaching the other.
The Complexity of Width, Grip, and Rolling Resistance
It is sometimes claimed that a narrower tyre always has higher rolling resistance and a wider tyre always grips better. The evidence does not support such broad generalisations. Rolling resistance depends on casing, compound, pressure, and surface, not width alone. Grip depends on compound, contact patch, loading, and your surface.
A narrower front tyre presents less frontal area to the oncoming air. Whether that translates to a meaningful drag reduction for you depends on the specific tyre, the rim it sits on, your riding speed, and the yaw environment.
For broken tar around Johannesburg or loose Karoo gravel, assess surface demands alongside aerodynamic fit. Do not shrink the front tyre merely to satisfy a ratio. A wider rear can be a candidate for supporting its actual load at a suitable pressure, not an automatic improvement.
Rear Wheel Handling Effects
The rear wheel is not neutral in crosswind handling. Side forces on the rear wheel create lateral displacement and can affect the bike's roll and yaw stability. The effect differs from the front wheel's steering-moment response, but it is not zero. Both wheels contribute to the rider's overall experience of crosswind stability.
Measured Inflated Width vs Nominal Size
A tyre labelled 28 mm does not necessarily inflate to 28 mm. The actual inflated width depends on rim internal width, tyre construction, casing material, and inflation pressure. This matters for aerodynamic analysis because drag depends on the real physical shape, not the printed label.
How Rim Internal Width Changes Inflated Tyre Width
A wider internal rim spreads the tyre bead further apart, increasing the inflated width. As a rough pattern, a given tyre will measure wider on a wider rim. The magnitude varies with tyre construction, so the only reliable approach is to mount the tyre, inflate it, and measure.
If you are evaluating the aerodynamic interaction between your tyre and rim, measure the actual inflated width on the specific rim at your intended pressure. Nominal sizing is not precise enough.
Measurement Conditions and Repeatability
Use a consistent measurement protocol: seat the compatible tyre correctly, inflate to the intended pressure, and measure its widest casing with callipers without squeezing. Record tyre model, labelled size, rim internal and outer widths, pressure, and whether the measurement is unloaded. Repeat after settling rather than assuming the first reading is final.
Record Shape, Not Just a Single Width Ratio
Record rim depth and both widths separately: internal width concerns bead spacing and tyre shape; outer width describes the exterior aerodynamic envelope. Measure front and rear independently. The same labelled tyre can form a different cross-section on another rim, so transferring one measured width across wheelsets is unreliable.
For comparison, keep the tyre model and pressure consistent, document casing age, and repeat measurements around the circumference. Distinguish maximum casing width from any protruding tread. A width ratio compresses a three-dimensional shape into one number; it cannot capture crown curvature, tread, or the complete rim profile.
Compatibility First: What Actually Determines Safe Tyre-Rim Pairing
Aerodynamic ratios do not determine whether a tyre is compatible with a rim. Compatibility is determined by the tyre and rim manufacturers' stated specifications. The critical factors are rim internal width range for the tyre size, bead system (hooked or hookless), the lower of the two manufacturers' maximum pressure ratings, and frame clearance.
A hookless rim, for example, has a specific maximum pressure ceiling and requires tyres rated for hookless use. Exceeding the pressure rating or using an incompatible tyre risks bead blowoff. These are safety constraints that no aerodynamic consideration overrides.
Check the manufacturer's compatibility tables for both rim and tyre before fitting. Aerodynamic preferences are secondary to safe, reliable operation.
Speed, Apparent Wind, and Yaw Angle
At constant drag coefficient, aerodynamic force scales with apparent air speed squared. Power against travel-direction drag also depends on ground speed. There is no universal speed where aero starts to matter: a wheel’s absolute watt difference changes continuously, alongside rolling, climbing, and other resistance.
How Speed Affects the Magnitude of Drag Differences
Consider a simplified model. Assume a delta CdA of 0.002 m² between two setups, air density of 1.225 kg/m³, still air, level ground, steady speed, constant CdA. Using P = 0.5 × ρ × CdA × v³:
- At 30 km/h (8.33 m/s): approximately 0.71 watts difference
- At 40 km/h (11.11 m/s): approximately 1.68 watts difference
- At 50 km/h (13.89 m/s): approximately 3.28 watts difference
This is illustrative modelling, not a measured on-road gain and not a product performance claim. The v³ relationship applies to power for overcoming drag in the travel direction in still air.
In crosswinds, apparent air speed differs from ground speed. Resolve the total aerodynamic force into bicycle-axis components, then multiply the longitudinal resistance by ground speed. Wind-axis drag and side force are different components. Applying apparent speed cubed blindly does not give the rider’s required propulsive power.
Yaw Angle on Real Roads
Yaw angle is the angle between the direction the bike travels and the direction of the apparent wind. In still air, yaw is 0°. With a purely perpendicular steady 10 km/h crosswind, yaw at 40 km/h ground speed is arctan(10/40) = approximately 14°. The same crosswind at 30 km/h gives arctan(10/30) = approximately 18.4°.
In this perpendicular-wind example, the slower rider experiences higher yaw. The yaw-angle environment a rider encounters depends on their speed, route geography, and local wind conditions. No single "typical" yaw distribution applies universally.
Crosswind Forces: Side Force, Steering Moment, and Gust Response
Increasing rim depth can increase crosswind side force, but the amount depends on geometry and yaw. Crane and Morton (2018) found that side force was mainly related to rim depth within their test matrix.
Jermy, Moore, and Bloomfield (2008) tested rotating wheels in a wind tunnel at 30 to 50 km/h across yaw angles of 0° to 50°. Side force related to the wheel's projected side area. Rotational drag was a significant component of total drag in their measurements.
Earlier work by Greenwell et al. (1995) examined how wheel geometry affects crosswind forces, establishing that the relationship between geometry and crosswind response is real and measurable, though the specific equipment tested is now historical and cannot be used to validate modern watt-savings claims.
Why Front-Wheel Steering Moment Matters
Front-wheel aerodynamic forces can generate torque about the steering axis. The resulting steering input depends on where those forces act, not just their magnitude. Two wheels with similar side-force readings can therefore present different steering demands. Ask for steering-moment data rather than treating side force as a complete stability measure.
The rear wheel also experiences side force. This force creates lateral displacement and can affect the bike's roll and yaw. It does not create a direct steering input, but it is not zero in handling terms. Both wheels matter for overall crosswind behaviour.
Gust Response
Steady crosswinds allow you to hold a constant lean and correction. Gusts demand quick reactions to sudden changes in side force and steering moment. Rim profile geometry affects how forces build as yaw increases, but broad guarantees about specific shapes always being more stable are not supported by available evidence.
A shallower front with a deeper rear is a candidate to evaluate for exposed riding, not a guaranteed stability solution. PLUS Aero lists the RSL 40 as a shallower road option. Product depth is a specification, not a measured handling result.
The RSL 50 provides another depth for comparison. Before considering a mixed pair, confirm availability, interfaces, tyre clearance, and intended use. This article does not establish a drag or steering advantage for either model.
Watt Savings: What the Numbers Actually Depend On
When a manufacturer or reviewer claims a wheelset saves a specific number of watts, that figure rests on a set of assumptions. Understanding those assumptions is essential to evaluating whether the number is meaningful for your riding.
What Goes Into a Watt-Savings Calculation
A watt-savings claim converts a measured or modelled drag difference into power at a stated speed. The key variables are:
- Drag-area difference: The difference in CdA between configurations, inferred from measured forces or predicted by a simulation. CdA combines drag coefficient and reference area.
- Rider speed: The assumed ground speed. Power scales with v³ in still air, so the same CdA delta produces very different watt figures at different speeds.
- Air density: Standard conditions assume approximately 1.225 kg/m³. At altitude or in warm conditions, density drops and so does both drag and the potential saving.
- Baseline wheel: The reference wheel matters. A claim of "saves 5 watts" means 5 watts less than that specific baseline at that specific speed.
- Test configuration: Isolated wheel, wheel with tyre, or full bike with a rider or mannequin. Include tyre model, measured width, pressure, wheel rotation, and any rotational-power allowance.
Yaw Weighting and Measurement Uncertainty
How a comparison averages yaw angles and handles uncertainty can change its headline result.
- Yaw weighting: The angles tested and the proportion assigned to each. A weighted result changes when those assumed proportions change.
- Uncertainty: Repeat runs, calibration, and the uncertainty of the difference itself. A small headline saving may not be distinguishable from test variability.
Request the drag-versus-yaw curve as well as the weighted average. An average can conceal a reversal between setups at particular angles. Neither an especially favourable single yaw nor a distribution borrowed from another route establishes your expected saving.
Watts vs Time Savings
Converting watts saved into time saved over a distance requires further modelling. The relationship depends on course profile, pacing strategy, wind, and your total power. Even a flat, steady-speed estimate needs a complete resistance model to turn a watt difference into a new speed. A real course additionally includes gradients and changing conditions. Treat time-savings claims with additional caution.
Test Methods: Distinguishing CFD, Wind Tunnel, and Their Limitations
Not all aerodynamic evidence carries equal weight. The method used to generate a claim determines how much confidence you should place in the result.
Computational Fluid Dynamics (CFD)
CFD uses numerical methods to simulate airflow around a digital geometry, rather than measuring a physical wheel. It is valuable for design iteration because it can test many variations quickly. Its accuracy depends on mesh resolution, turbulence model, boundary conditions, and validation. Unvalidated CFD results should be treated as design predictions, not performance proof.
Wind-Tunnel Testing
Wind tunnels measure real forces on physical objects in controlled airflow. They are generally more reliable than unvalidated CFD for comparative drag measurements, but carry their own uncertainty sources. Tunnel blockage, turbulence intensity, support interference (tare corrections), whether the wheel was rotating or stationary, and whether a rolling road was used all affect results.
Rotating-wheel tests with a rolling ground plane are more representative than stationary tests. The rotational component of wheel drag, as Jermy et al. (2008) measured, is significant and missed entirely by stationary tests. Repeatability and stated uncertainty ranges matter. If the uncertainty of a measured difference includes zero, the test has not clearly resolved which setup has lower drag.
From Drag to Watts: The Modelling Step
A tunnel’s drag-derived watt figure is calculated from measured force and specified speed. It is not a direct measurement of a rider’s on-road saving. Tests may separately measure rotational torque or field power. Identify which quantity was measured, which was calculated, and which assumptions connect them.
Controlled Field Tests Measure a Different Kind of Evidence
Controlled field testing can estimate a setup difference under riding conditions, but it must separate aerodynamic change from changing wind, rolling resistance, position, and power-meter error. A faster lap or lower average power on one ride does not isolate a wheel’s aerodynamic contribution.
For a useful comparison, alternate setups over repeated runs, hold position and clothing consistent, document tyre pressure and course conditions, and report the spread of results. An A–B–A sequence helps reveal drift. This is a suggested comparison protocol, not a claim that the wheelsets in this article have passed it.
Rider Experience Informs Fit and Handling, Not a Drag Number
Rider experience is valuable evidence about comfort, confidence, steering corrections, and the ability to hold position. It does not independently measure aerodynamic drag. A stiff or noisy wheel can feel quick without establishing lower resistance, while a calmer setup may help a rider maintain their preferred position.
Describe impressions as impressions: which rider, which route, which tyres and pressures, and what wind conditions. Do not convert “felt faster” into watts. A measured aerodynamic saving, a modelled prediction, and a rider’s preference can all be useful, provided they remain distinct.
Practical Wheel and Tyre Selection Framework
Choosing the right wheel-and-tyre setup means matching equipment to the conditions you actually ride in, considering multiple interacting variables rather than optimising one in isolation.
Terrain and Surface Quality
Smooth surfaces let you emphasise aerodynamic considerations. Rough or broken surfaces shift your priorities toward comfort, durability, and control. South African road conditions range from smooth national-route tarmac to severely degraded municipal roads. The conditions you ride determine which variables matter most.
Typical Riding Speeds and Wind Exposure
The power cost of aerodynamic drag differences increases with your speed. At lower solo speeds, the watt difference between two setups is small in absolute terms. At higher speeds or in fast group riding, the same CdA difference costs more watts. Your wind exposure and route geography determine the yaw environment and crosswind demands.
Tyre and Rim Compatibility
Start with the manufacturer's compatibility specifications. Check rim internal width range, bead system, pressure limits (the lower of your tyre and rim ratings), and frame clearance. These are non-negotiable safety constraints. Your aerodynamic preferences operate within the range that compatibility allows.
PLUS Aero’s AXL 20H is a road catalogue example to investigate once your requirements are defined. A product description is not evidence of a particular watt saving. Confirm the exact supplied version rather than combining specifications from different listings.
Compare Front and Rear Tyres Under Their Actual Loads
Choose each tyre’s pressure for its load and approved operating range rather than assuming both wheels need the same setting. Check that your proposed front width still supports braking and cornering demands. At the rear, evaluate load support and clearance alongside any aero objective.
Compare three candidates if practical: your existing setup, matched widths, and a narrower-front/wider-rear option. Keep tyre construction comparable so a compound or casing change does not masquerade as a width benefit. Reject any option that requires unsafe pressure or compromises control, regardless of the modelled aero result.
Handling Confidence
Aerodynamic optimisation means nothing if you do not trust the front end. If a wheel unsettles you, account for changes in posture, braking, and line choice before calling it the faster practical setup. Choose a depth and profile that lets you ride confidently in the worst conditions you expect.
Gravel-Specific Considerations for Aero Wheel Selection
Gravel demands a separate setup assessment rather than direct transfer of narrow-road-tyre findings. PLUS Aero’s gravel wheelsets illustrate a different category of application. Tyre casing, tread, inflated dimensions, and surface conditions need to match any aerodynamic comparison.
When Aerodynamics Apply on Gravel
On fast, hard-packed gravel at sustained higher speeds, aerodynamic drag is still a meaningful force. Gravel races on smooth jeep track or compacted farm roads create conditions where aerodynamic differences between wheels may contribute measurable drag reduction.
On loose, technical gravel or sand, evaluate grip, vibration, and rolling losses before sacrificing tyre suitability for a predicted drag benefit. Their relative importance is route-dependent; the road-wheel studies here do not quantify a gravel crossover speed.
Wide Internal Widths and Tyre Support
Changing internal width changes the mounted tyre shape, but wider is not an unlimited improvement. For a catalogue example, the GSL 54 lists gravel-specific dimensions. Stay within the approved pairing and evaluate support, pressure, and clearance. A large-volume tyre needs testing as part of its own wheel system; frontal width alone cannot establish the drag penalty.
Conflicting Evidence and Unresolved Questions
Not every aerodynamic question has a settled answer. Acknowledging what we do not know is part of making honest equipment choices.
Width, Rolling Resistance, and Drag Trade-offs
The relationship between tyre width, rolling resistance, and aerodynamic drag is not simple. Rolling resistance depends on casing construction, compound, pressure, and surface, not width alone. Aerodynamic drag depends on the inflated shape relative to the rim. Published tests vary in their conclusions partly because test conditions, tyre models, and surfaces differ. No single crossover point applies universally.
Spoke Drag and Rotational Effects
Spokes are another reason not to rank wheels on rim depth alone. Jermy et al. (2008) reported significant rotational aerodynamic losses. PLUS Aero’s AXL 24H is a different build to the 20H option, but spoke count alone does not establish their measured drag difference.
Read Historical Research as Evidence, Not a Product Ranking
The research discussed here is historical and its principal findings were checked against publisher abstracts or publisher-deposited abstracts, rather than full-text methods. Publisher access restrictions may apply. It supports relationships between variables, not a ranking of PLUS Aero products. Full methods and raw data are needed before reproducing a particular test or extracting an unreported watt figure.
Manufacturer explanations have a different role. SILCA’s ratio guidance explains a practitioner heuristic, while PLUS Aero’s pages describe its wheel range. Neither category replaces an independent, controlled comparison of your exact tyres and wheels.
Limitations of Available Evidence
The peer-reviewed studies cited here tested specific equipment that does not represent the full range of modern designs. Do not assume Crane and Morton’s narrower test matrix predicts every modern wide-rim combination. Greenwell’s equipment is historical, and Jermy’s results describe the wheels tested. These are limits of applying the evidence here, not claims that the authors tested every contemporary alternative.
Treat all aerodynamic claims as applying to their specific test conditions unless independently replicated.
Choose Aero Wheels Around Your Conditions and the Evidence
The evidence supports several positions. Rim profile and tyre-rim width interaction affect aerodynamic drag independently of rim depth alone. Both wheels contribute to drag and to handling. Measured inflated width, not nominal size, determines the real aerodynamic shape. Watt-savings claims require stated speed, baseline, density, and test method to be meaningful.
The evidence also has limits. No universal ideal tyre width, rim depth, or aero threshold speed exists. The right choice depends on your speed, terrain, wind, and handling priorities. Start with safe tyre-rim compatibility. Match tyre volume to your surface. Verify tyre-rim fit with a measured inflated width, not a nominal label.
FAQs About Aero Wheels, Rim Design, and Tyre Setup
Does a deeper rim always mean lower aerodynamic drag?
No. Crane and Morton (2018) showed that the tyre-to-rim width ratio correlated with wind-averaged drag across their test matrix. Evaluate profile shape and tyre interface alongside depth. Evaluate the whole wheel-tyre system, not depth alone.
What is yaw angle and why does it matter for aero wheels?
Yaw angle is the angle between your travel direction and the apparent wind direction. A perpendicular 10 km/h crosswind at 40 km/h produces approximately 14° yaw. Wheel drag and side-force behaviour change with yaw, so single-angle test results do not tell the full story.
How does PLUS Aero's range address different riding conditions?
PLUS Aero offers wheelsets from shallow to deep across road and gravel categories. The range lets you match rim depth and internal width to your tyre choice, riding speed, and wind exposure. Consult the product pages for current compatibility specifications.
Should I run different tyre widths front and rear?
The front wheel operates in cleaner airflow, so changes to front tyre width may have a proportionally larger aerodynamic effect. However, both wheels affect handling and total drag. Test the whole system rather than assuming a narrower front always produces a net benefit.
Are watt-savings claims from wheel manufacturers reliable?
They are only as reliable as the stated assumptions. A claim requires a defined baseline wheel, rider speed, air density, test method, and uncertainty range. Without those details, the number is not useful for comparing products or predicting your own performance.
Can aero wheels benefit gravel riders?
Aerodynamic drag still applies on gravel, but the cited road-wheel studies do not quantify your gravel saving. PLUS Aero positions the GSL 54 for fast gravel use. Confirm tyre suitability first, then seek relevant test data rather than transferring a road-wheel watt figure.
How should I assess aero claims about PLUS Aero wheels?
PLUS Aero’s product pages describe wheel configurations, not a measured watt saving established by this article. For an aero claim, request the exact tyre setup, baseline, speed, yaw range, test method, and uncertainty. Keep CFD predictions distinct from physical measurements and rider impressions.
How do I determine if a tyre is compatible with my rim?
Check both the rim and tyre manufacturers' specifications. The key factors are internal width range, bead system (hooked or hookless), the lower of the two stated maximum pressure ratings, and frame clearance. These safety constraints take priority over any aerodynamic consideration.